here's the introduction/announcement of the
Backtesterapp, if you haven't read it already
in this post, we'll jump right into how to use the Backtester app
most backtesting tools out there requires you to write code in order to have a strategy backtested.
but, we want most of the general audiences(and not just programmers) to benefit from backtesting and hence we've defined a way for our app users' to formulate the conditions using selectable options which means its a no-code backtesting tool that anybody with a minimal understanding of technical analysis could make use of.
in the earlier post, we discussed about how a Strategy to be backtested could be represented as conditions, that's what we're going to look at first and breakdown the different jargons involved in it.
technical indicator
a
technical indicatoris a mathematical calculation based on the historic price, volume & open-interest information that aims to identify pattern & forecast stock's direction
this is a slightly tweaked version of the usual definition
think technical indicator as a representation of a math formula that could be applied to the stock's historical price data to identify the pattern and possibly predict its future behaviour [based on the pre-conceived agreement on technical analysis that the History repeats itself]
read more about technical indicators and the different kinds that we support in our app
to formulate a condition for a Strategy, we'll be using technical indicator along with other math symbols like brackets, combinators, comparators, functions & operators
technical indicator example
as an example, lets take one technical indicator called: moving average
moving average indicator does take period as input which represents the number of days(talking in day timeframe for simplicity)
what moving average indicator does is it takes the price values of all the previous period / number of days and derives an average value out of it.
basically its a simple math formula to take an average of the prices in a certain range/period.
dont worry, if none of this is making sense till now, as it would when we define a strategy.
defining a Strategy
now lets put together everything and define a strategy.
take a note that we need a entry signal and an exit signal
lets take the most simplest investment strategy there is, which is to buy low and sell high, that works well on any good business/stock in the market and it goes like this:
entry
Buy: when the closing price is lower than 200 day moving average
which in other words mean, we buy a stock when there's a significant correction
exit
Sell: when the closing price is higher than the previous All Time High price
in other words, we sell or exit the trade when the price reaches or closes above the previous all time high price that it had made earlier historically
Backtesting time
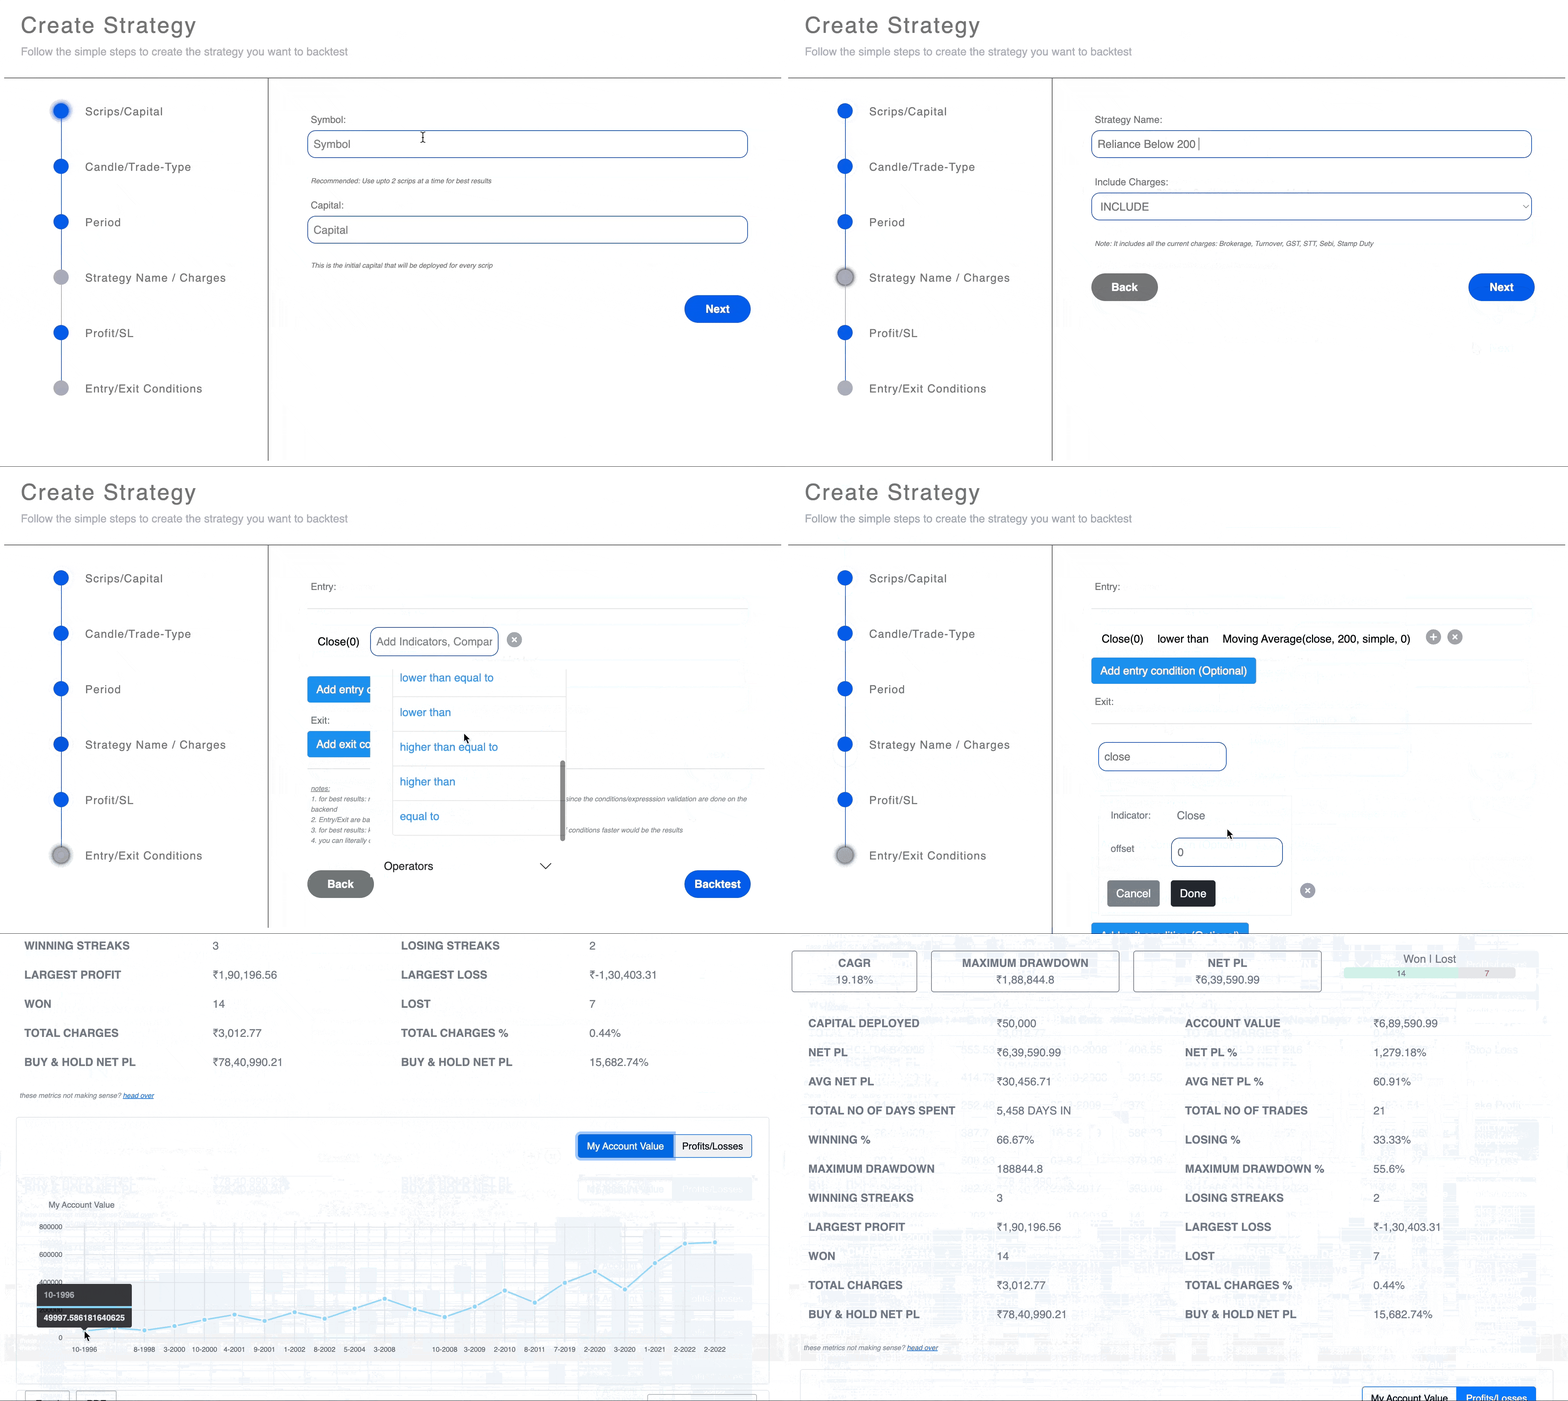
now, lets jump into our app and define the above mentioned strategy to backtest.
the way to define these entry / exit conditions in our app is pretty straight-forward and let's not bore you with words and instead show it in action with the stock 'RELIANCE', the india's biggest company (at this moment):
applying our investment Strategy in RELIANCE

also, you can watch the full video video here with a breakdown of each input parameters given for the strategy.
and if you would like/prefer to read about other input parameters, they're all described here
conclusion
there are a wide variety of technical indicators that the app supports and you can use them to formulate almost any strategy, which means literally your imagination is the limit!
and dont hesitate to connect with us, if you're struggling to define a strategy, we'd be more than happy to help
note: app currently supports backtesting with: all symbols from NSE & AMFI[Equity, ETFs & all Mutual Funds]
No comments yet. Login to start a new discussion Start a new discussion